Live Cell Analysis of Wound Healing
Perform a Wound Healing Migration Assay by Monitoring and Quantifying Cell Growth in a Defined Area
- Measure the confluence and cell count of cells migrated into the exclusion (scratch) zone
- Acquire multiple images of the same plate to produce a kinetic reading of wound healing
- Perform wound healing assay using bright field and/or fluorescent imaging
Imaging and Quantification of a Wound Healing Assay

In a wound healing migration assay, a wound is produced on a fully confluent cell layer by a mechanical tool or by a device inhibiting cell growth in a defined area. Celigo is used to image the entire well with a wound at multiple time points. Confluence is automatically calculated for each well. The increase of confluence directly measures cell migration.
Celigo Wound Healing Application using the 96-Well Platypus Oris™ Plates
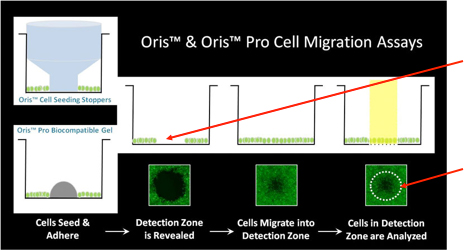
Removing the well stopper leaves an exclusion zone into where the cells migrate.
The Celigo detects cell migrating into the exclusion zone either in bright field or fluorescence.
Wound Healing Application Protocol
- Seeded cells overnight
- Removed the well stopper from the Oris™ plate (alternatively, perform a manual scratch)
- Wells were imaged using Celigo green channel (various exposure time for dim or bright GFP cells)
- Plate was acquired at: 0h, 19h, 24h, 43h and 71h post stopper removal
- Analysis
- Wound Healing application was setup with a 36% well mask reduction to define the analysis area
- Acquisition and analysis parameters were saved to re-use for all time points
Plate Map: Cell Type and Conditions

Legend: NC – Negative Control, KD – Knockdown
Measuring the Migration of GFP-Labeled Cells using Platypus Oris™ 96-Well Plates
Whole-well images are acquired and the analysis area is defined by the Celigo software.
The Celigo Wound Healing application reports the wound healing confluence and cell count for each well over time within the defined analysis area.
Whole well fluorescent image

Plate cells. Remove stopper and Image whole well in fluorescence.
Definition of analysis area

Analysis area is defined by reducing well mask size (36% of the total well area).
Analysis area (Zoomed)

Celigo measures and reports the confluence and cell count within the analysis area.
Wound Healing Quantification of GFP-Labeled H1299 Cells

Celigo generated growth curves at the well and plate level for H1299-GFP cells
Increased Wound Healing % = Wound Healing % (71h) – Wound Healing % (0h)
Two seeding densities were tested: 70% and 85%. These seeding densities refer to the confluence of the original plate that was used for seeding onto the Oris plate.
Data indicates that similar wound healing trends were seen for both 70 and 85 percent confluent samples.
In the table below, A549 cells appear to have migrated the least into the wound compared to other cell types in the study.


Celigo Live Cell Analysis of Wound Healing Imaging and Quantification using Bright Field Analysis
Whole-well bright field image

Plate cells. Remove stopper and image whole well in bright field.
Definition of analysis area

Analysis area is defined by reducing well mask size (36% of the total well area).
Analysis area (Zoomed)

Celigo measures and reports the confluence and cell count within the analysis area.
Cell Type and Plating Density

The Celigo Wound Healing application reports the wound healing confluence and cell count for each well over time using bright field imaging without requiring dye staining or GFP transfection.
U87 and HepG2 cells were plates at initial confluence measurement of 70 and 85%.
Measuring the Migration of Labeled HepG2 Cells using Platypus Oris™ 96-Well Plates
0 hours after stopper removal

24 hours after stopper removal

43 hours after stopper removal

71 hours after stopper removal

The top row of images shows the whole-well bright field image with fill. The bottom row shows a zoomed view of the segmentation.
Wound Healing Quantification of Labeled H1299 Cells using Bright Field Analysis


Live cell analysis of increased Wound Healing % = Wound Healing % (71h) – Wound Healing % (0h)
Two seeding densities were tested 70% and 85%. These seeding densities refer to the confluence of the original plate that was used for seeding onto the Oris plate.
Data indicates that similar wound healing trends between U87 and HepG2 cells were seen for both 70 and 85 percent confluent samples.

Comparison of Wound Healing Confluence Between Bright Field and Fluorescence Analysis
Bright Field Analysis

Bright Field H1299-GFP (85%)


Fluorescent Analysis

Fluorescent H1299-GFP (85%)

Wound healing confluence between Bright Field and Fluorescence analysis showed no significant difference between the two analysis methods.
Wound Healing Assay using Schwann and HUVEC Cells in 24-Well Plate
Protocol
- Place Cyto-select insert into well
- Plate high number of cells so that confluence is reached overnight
- Remove insert (Ideal time 0)
- Read plate
- Add growth or conditioned media to wells
- Read plate at 0,4,8, 24, 31 hours

Zoom View of Schwann Cell Wound “Closure” Over the Course of 31 Hours
0 Hours
The diagram shows the area of the well shown in zoomed images 0, 4, 8, 24 and 31 hours.

4 Hours

8 Hours

24 Hours

31 Hours

The Celigo wound healing application reports the wound healing confluence and cell count for each well.